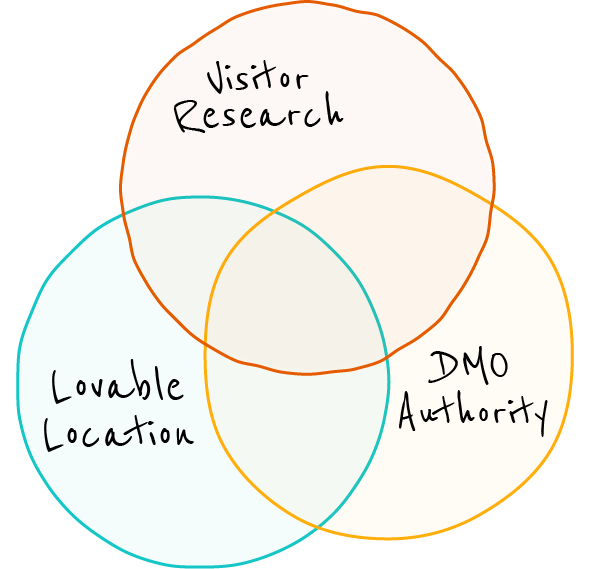
Provoked by an existential crisis in 2015, and rapidly committed to whiteboard by myself and Ellen West, the DMO Venn Diagram was designed to help us think through our role as destination marketers.
Pretentiously, it is a conceptual framework for the strategic analysis of our work, but at its core it’s just three circles on a whiteboard.
If this is your first month at a DMO, and you’re asking yourself, “What exactly are we doing here?”, perhaps this will help. In comparison to the laundry-list style of What do DMOs do?, this framework provides a little more explanation of why we do what we do, as well as offering a jumping-off point to evaluate the relative merits of those activities in your specific context.
On the other hand, if you lead a DMO, this framework provides a way to zoom out. It helps clarify where your organization is most effective, where effort may be misaligned with mandate or impact, and where strategic choices—about growth, stewardship, visibility, or restraint—are being made implicitly rather than deliberately. By distinguishing between expressed and latent demand, and between promotion and stewardship, the diagram provides a shared language for prioritization, decision-making, and trade-offs, allowing leadership teams to align strategy with values and long-term outcomes for both visitors and the place itself.
So, how does it work?
To begin with, let me take you through the circles one by one.
For the purposes of this walkthrough, I’ll be focusing on leisure tourism, but the model can easily be adapted to consider a DMO’s B2B audiences by considering the meeting planner, journalist or tour operator’s “research”.
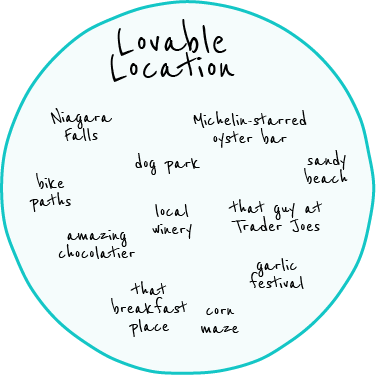
Lovable Location
The lovable location circle holds everything that’s lovable about the location you’re marketing. Everything that makes it special to live in, anything both unique and cool, its je ne sais quoi, those elements one hopes will endure.
If you’re not having the greatest day ever, you can go ahead and make a list of these right now, it might help!
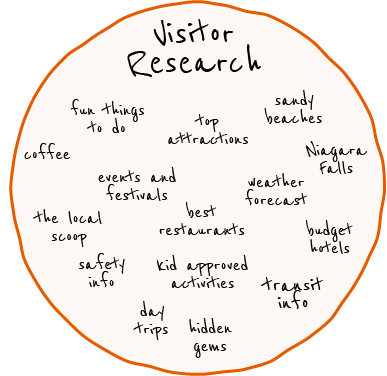
Visitor Research
In the visitor research circle, we collect all the questions visitors typically ask across all phases of their travel journey, from “what’s a nice place to visit this summer?” to “what bus do I need to take from downtown to get me to the airport by 8:45am?”
You can get a sense of these questions by examining organic search volumes, polling visitor center staff, or chatting with a hotel concierge or a Lyft driver. For the purposes of our diagram, we just write down the topics these questions address.
Questions arise at various stages of the visitor journey [potential link] and at varying levels of specificity. As a traveler, you may want to…
- plan a visit to Niagara Falls (highly specific)
- go to a museum (medium specificity, directional)
- do something fun this afternoon (non-specific aka vague)
In terms of economics, all of these questions are manifestations of expressed demand.
If we want to get formal, visitor research refers to the evolving set of consciously articulated information needs a visitor seeks to resolve as they plan and navigate their trip, encompassing search behavior, comparison, logistics, and decision-making. It is necessarily constrained by what a visitor already knows exists; people can only research what has entered their awareness.
In 2025, visitor research is often mediated by Google, informed by websites and apps and through consultation with friends and AI assistants.
But, for now, we can just think of this circle as the big bundle of things visitors want to know about.
Visitor, meet Destination
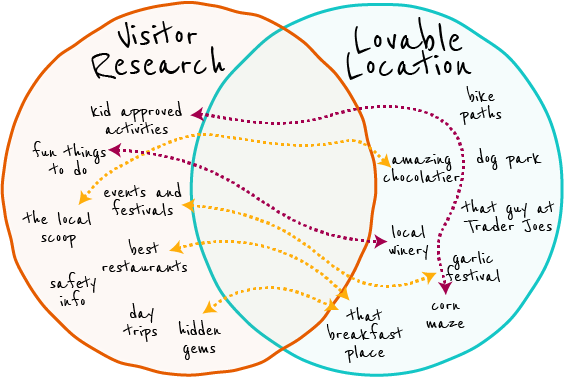
With luck, a visitor’s research will overlap with your lovable location. Thanks to Google Maps, Trip Advisor, OTA websites, weather apps and, perhaps, a subscription to Condé Nast Traveler, all sorts of research questions will be answered.
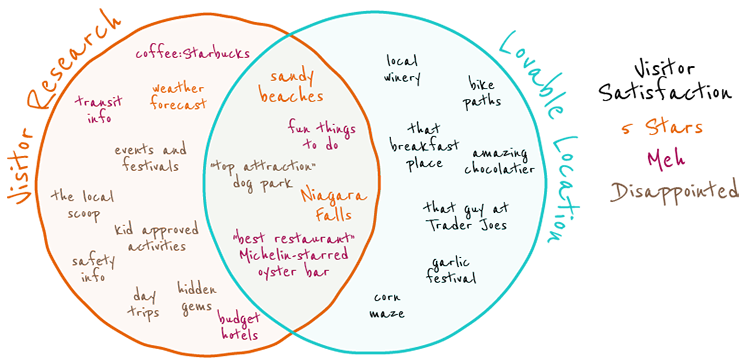
Things could be better, though. Better for the traveler, in terms of their lived experience, and better for the destination in terms of directing spending into the local economy.
Firstly, there are the less-than-lovable connections. We’re connecting with the destination, but not the most lovable bit. Starbucks Coffee is fine, but perhaps the visitor would have had a more memorable experience if they’d found a locally owned coffee shop? Bus and train schedules are often available through Google Maps; however there are usually a host of subtleties to navigating transit systems that are confusing to outsiders, such as how and where to purchase and validate tickets.
Then there are not-lovable-to-me connections. ChatGPT confidently presented a list of top attractions, but the sources it drew from were out of date and one of them was written by the neighborhood association, and thus it led the visitor to a dog park. Wait, you say, that dog park is totally lovable, that’s why I put it in that circle. And it is, to you, and quite possibly to a visitor that brought their dog with them. But this visitor was more of a cat person, and a municipal park is not – for most people – a big draw.
Next there are suboptimal connections. Research revealed some fun things to do, but they didn’t suit that visitor’s tastes. The Michelin-starred oyster bar is expensive and not actually the best restaurant in town; plus, you have to book two weeks out, and the visitor didn’t realize that.
Lastly, and worst of all, there remain a whole host of missed connections – things visitors want that this lovable location could satisfy, if only they had been pointed in the right direction. Their searches for kid approved activities and hidden gems came in dry… yet there is a corn maze that the kids would have loved, and an amazing chocolatier half a mile from their hotel.
The key challenge lies in effectively bridging the gap between the visitor’s articulated needs and the location’s little-known and lovable suppliers.
This is, needless to say, where DMOs come into the picture.
DMO Authority
The golden circle represents the DMO’s authority, the conceptual space within which people trust in our expertise.
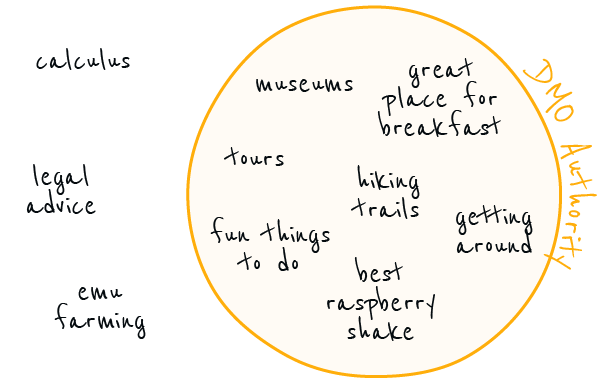
Layering the boundaries of that authority across the visitor’s research and the lovable contents of the destination will provide us with some insight into the rich and varied roles played by the DMO.
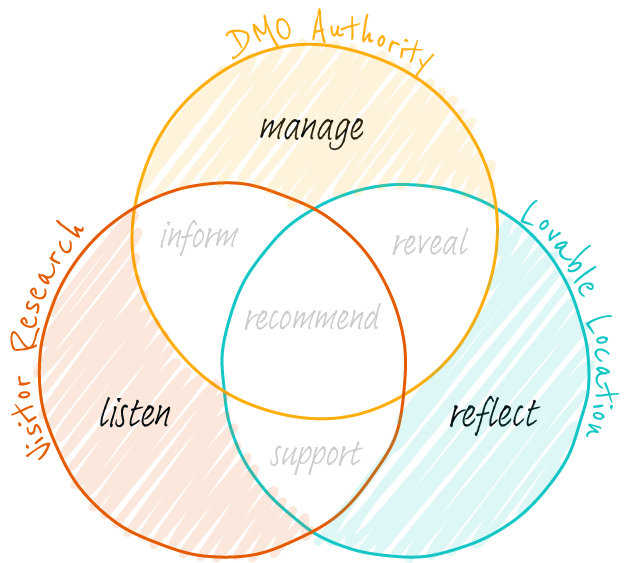
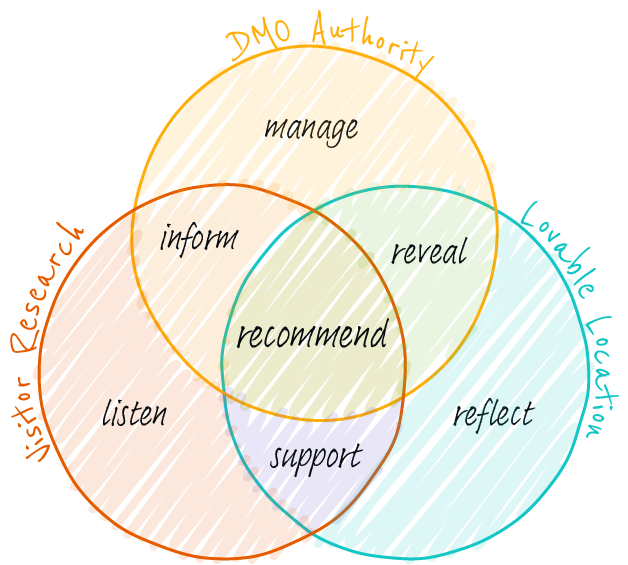
Sections and Intersections
Overlapping our circles creates a Venn diagram with seven distinct zones. We’ll step through each in turn, beginning with the areas that intersect with DMO Authority.
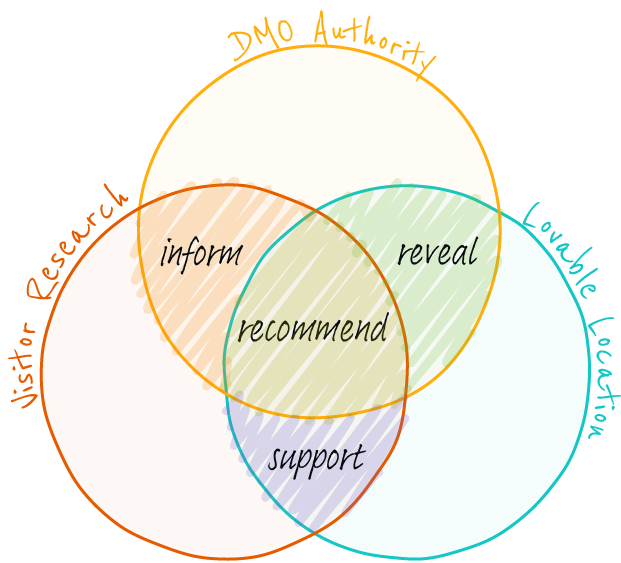
I’ve labelled the intersections Recommend, Reveal, Inform and Support to indicate the DMO’s primary role in each area.
Recommend (Visitor Research × Lovable Location × DMO Authority)
The center of the diagram represents the DMO’s most available opportunity to drive visitation and enhance the visitor experience. It is here that the seeker of events is directed to the garlic festival, the parents discover the corn maze and that conference delegate with the afternoon off finds the local winery. It’s also where those intrepid travelers seeking the inside scoop are pointed toward the uptown chocolatier, and learn that that breakfast place really is something special.
As touched on in my post What do DMOs do?, the simplest way to think of a DMO is as a matchmaker. A destination’s website, their printed visited guide, face-to-face conversations at their visitor center, responses to DMs on social channels or a regram of another traveler’s discovery, all represent opportunities to connect engaged visitors to the local experiences that will bring them the most joy.
This is the realm of information services and soft marketing.
It makes sense for DMOs to focus their efforts in the recommendation zone, because this is where they can make the biggest impact at the lowest cost. Every other zone is less efficient to play in, either because there is no explicit demand, or no lovable supply, or they’re not the most trusted authority on the topic, or a combination of those factors.
Reveal (Lovable Location × DMO Authority)
People don’t know what their missing, and it’s the DMO’s job to reveal the lovable opportunities of which they’re unaware. Rather than responding to existing demand, the zone of revelation focuses on expanding awareness.
Here lie the Lovable Location’s treasure trove of hidden gems. It’s all the wonderful things that would draw new visitors to the location, if only they knew they were there to be experienced; the lesser-known neighborhoods, the cultural traditions, the unique landscapes, architecture and cuisine, the niche attractions that aren’t for everyone, but that will bring untold joy to the few.
It’s also the realm of brand development – the active crafting of the public perception of the destination as a whole, the work of shaping how the destination is understood and felt before a visitor ever searches for it. Here DMOs establish the emotional and narrative frame that makes a place legible and desirable, conveying identity, values, atmosphere, and character by surfacing and abstracting its most lovable elements.
Revelation enables discovery by introducing people to possibilities they weren’t yet looking for. It precedes research by stimulating new demand. It’s primarily the realm of advertising and PR – which makes it an expensive place to play.
In economic terms, the zone of revelations explores latent demand, beyond the bounds of the expressed demand of the Visitor Research circle.
Inform (Visitor Research × DMO Authority)
The information zone covers everything visitors would like to know about your destination beyond the most transparently lovable bits.
This includes travel logistics: wheelchair accessibility, how to navigate the local bus system, where to park and directions to generic service providers such as drugstores. It might also include the locations of those quasi-attractions that hold mysterious, legacy appeal despite their forlorn state (I’m looking at you, Voodoo Doughnut).
The military aphorism, “Amateurs talk strategy. Professionals talk logistics” feels not out of place here. DMOs lionize marketing strategy, but many a trip is ruined by logistical failures or saved by someone knowing exactly who to call to get things back on track. Basic practical information tailored for the visiting public is the grease which keeps the whole machine ticking.
Reliable information also addresses any concerns visitors might have about their trip with regards to say, safety and security, or how not to offend local customs.
The role of the information zone is to improve the visitor experience by resolving uncertainty and reducing friction. It’s the realm of information services and, to a certain extent, reputation management through strategic communications.
Support (Visitor Research × Lovable Location)
Our Venn diagram contains an intersection where visitor needs are satisfied in the Lovable Location without DMO intervention. Recalling our earlier two-circle example, it’s where we find those attractions or features that sell themselves, that have sufficient weight in the public consciousness that anything a DMO might have to say about them is economically unimportant.
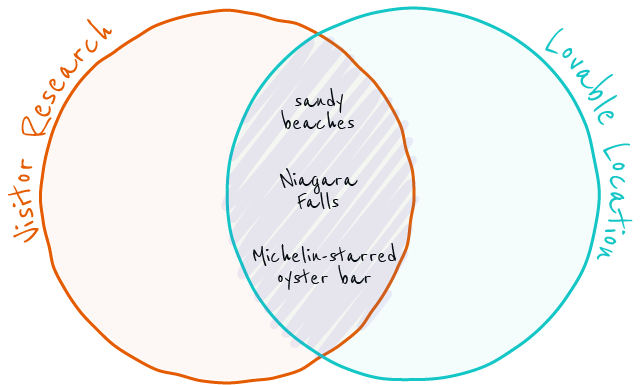
Obviously, this is great. Frictionless, if you will.
While these experiences do not require DMO mediation to be discovered or chosen, they often benefit from DMO stewardship and advocacy; hence the DMO’s role here is one of support. Significant attractions are a key part of a destination’s draw and will cast a halo effect on broader marketing efforts. Meanwhile, the DMO’s ability to advocate on behalf of the local tourism industry as a whole lends additional political weight to the attraction’s needs.
This may have particularly relevance where external demand for the destination’s most lovable bits has negative ramifications for residents, or indeed the attraction itself or the destination as a whole… think litter accumulating on those sandy beaches, long lines of disappointed customers outside the recently lauded crookie store. In such situations the DMO’s role may be better framed as stewardship, using it’s influence to delicately balance the needs of the industry with those of the destination’s long term interests.
The Support zone is also the reservoir of the destination’s existing brand equity: the public perception of a location that is greater than the sum of its parks (pun intended). Paris is romantic, New York hustles, Dubai has limitless luxury, Rio knows how to party. Much like keystone attractions, these intangible qualities, to the extent they are distinctive and positive, may be harnessed by the DMO to support their efforts.
Beyond the Intersections
If you’re very curious, you might take a moment to consider the three zones within the diagram that do not connect with the others. What’s happening there?
Manage
The DMO has authority as both the embodiment of the local tourism industry and the unofficial representative of the visiting public, and, as such, has a substantial role advocating for the needs of both within the local policy-making arena. Additionally, as more destinations grapple with the ramifications of overtourism, DMOs have leant more heavily into their role as destination stewards, working to preserve and enhance the lovability of the location while maintaining economic growth.
This might mean coordinating with urban planners on accessibility, signage, and wayfinding; advocating for tourism interests in policy, funding, and infrastructure decisions; assisting in the management of the destination’s reputation; managing visitor flow to prevent overcrowding in popular spots; promoting off-season or less-traveled neighborhoods to distribute visitor traffic, and supporting the development of new, sustainable, tours, attractions and experiences.
In support of such work, DMOs typically measure the economic impact of local tourism, and share that intelligence with businesses and policy-makers.
Reflect
There are, of course, plenty of things that are lovable about a location that visitors are not particularly interested in and that the DMO is not best qualified to talk about or address. Perhaps it’s the tree-lined streets or the friendliness of the residents. Or perhaps the residents are in fact very uptight and stuffy, but unusually well dressed. Perhaps it’s your world-class bicycle infrastructure (which, though cool, will not be experienced by most visitors). Perhaps it’s that guy at Trader Joe’s.
At root, there is an essence or a spirit to a place, a unique history, culture and landscape which differentiates it, and which the DMO has the opportunity to reflect in its work. This is the brand of the city or region at large, which may be quite distinct from its specific appeal as a destination.
In certain situations, where visitor footfall threatens lovability, there may also be a need to protect and conserve that special something. Here the issue is one of sustainability.
Listen
There are things that visitors would like that your location doesn’t have, but might be able to develop. Or perhaps it does have them, but you had no idea people would be interested, so they’re not in your ads, and nobody knows about them. The gems hidden in plain sight, if you will.
Understanding what visitors want is important and it requires research. This might mean organizing surveys or focus groups to identify new target audiences or trends, or collecting and analyzing data on visitor behavior, spending, and satisfaction.
For completists, wondering what else might inhabit this zone… well there may be certain things that some visitors want that you do have, but you don’t care to talk about them. So we won’t.
Conclusion
If this feels like a lot to take in, that’s because it is: the model describes the full terrain DMOs are asked to operate within — from demand creation through visitor experience to stewardship of place. And unlike most organizations of similar size, DMOs are expected to deliver value simultaneously to visitors, residents, businesses, and policymakers. I didn’t build this diagram to simplify that complexity away, but to make it legible: to offer a shared language for naming what we’re doing, why we’re doing it, and what we’re implicitly choosing not to do. In that sense, it’s less a marketing framework than a governance one — a way to surface trade-offs, align priorities, and ensure strategy is being made consciously rather than by inertia. Future posts will unpack each zone with real examples and practical implications, so the framework can settle in and become something you can actually use.
Leave a Reply